Our critically acclaimed bestseller Visual Complexity was the first in-depth examination of the burgeoning field of information visualization. Particularly noteworthy are the numerous historical examples of past efforts to make sense of complex systems of information. In this new companion volume, The Book of Trees, data viz expert Manuel Lima examines the more than eight hundred year history of the tree diagram, from its roots in the illuminated manuscripts of medieval monasteries to its current resurgence as an elegant means of visualization. Lima presents two hundred intricately detailed tree diagram illustrations on a remarkable variety of subjects—from some of the earliest known examples from ancient Mesopotamia to the manuscripts of medieval monasteries to contributions by leading contemporary designers. A timeline of capsule biographies on key figures in the development of the tree diagram rounds out this one-of-a-kind visual compendium.
A Fellow of the Royal Society of Arts and nominated by Creativity magazine as “one of the 50 most creative and influential minds of 2009,” Manuel Lima is the founder of VisualComplexity.com, Design Lead at Google, and a regular teacher of data visualization at Parsons School of Design.
Manuel is a leading voice on information visualization and has spoken at numerous conferences, universities, and festivals around the world, including TED, Lift, OFFF, Eyeo, Ars Electronica, IxDA Interaction, Harvard, Yale, MIT, the Royal College of Art, NYU Tisch School of the Arts, ENSAD Paris, the University of Amsterdam, and MediaLab-Prado Madrid. He has also been featured in various magazines and newspapers, such as Wired, the New York Times, Science, Nature, Businessweek, Creative Review, Fast Company, Forbes, Grafik, SEED, étapes, and El País.
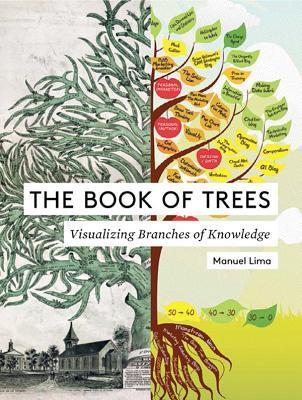
His first book, Visual Complexity: Mapping Patterns of Information, has been translated into French, Chinese, and Japanese. His second, The Book of Trees: Visualizing Branches of Knowledge, covers eight hundred years of human culture through the lens of the tree figure, from its entrenched roots in religious medieval exegesis to its contemporary, secular digital themes.
With more than twelve years of experience designing digital products, Manuel has worked for Codecademy, Microsoft, Nokia, R/GA, and Kontrapunkt. He holds a BFA in Industrial Design and a MFA in Design & Technology from Parsons School of Design. During the course of his MFA program, Manuel worked for Siemens Corporate Research Center, the American Museum of Moving Image, and Parsons Institute for Information Mapping in research projects for the National Geospatial-Intelligence Agency.
I can't compete with the New Scientist review http://www.newscientist.com/article/m..., and won't try: Just a remark that it helps explain why I love books around me, though people say I could always borrow a book, or e-read it. This is a book to catch sight of, dip into, and delight in the world and its peoples and its history.
Not what I assumed it would be about. More a book on data visualization than trees. A lot of reprints of the visual dictionary. Some of the ancient texts could have been interesting but were not large enough on the page to read.
This book was even quirkier and more “specialised” than The Book of Circles by the same author, showing the history of the presentation of knowledge through the format or symbol of a tree. Whether depicting a biblical ancestry or computer science data relations, a tree seems particularly suited to being a useful visual mnemonic depicting knowledge because different concepts, as well as their inter-relationships, can be presented as different branches, one following from, or leading to, another, and stemming from the same source(s) – the root(s).
The book tells us that the use of a figurative moral tree dates back to the twelfth century. There are the trees of virtues and vices, and there are also trees depicting various expressions of law, consanguinity (kinship relations), and science. For example, one of the examples of the latter was made by Ramon Llull in 1296, who depicted the tree whose branches represent the sixteen domains of science, and that tree also has eighteen roots divided between nine divine attributes (goodness, greatness, eternity, power, wisdom, will, virtue, truth, and glory) and nine logical principles (difference, concord, contrariety, beginning, middle, end, majority, equality, and minority). Then, there are vertical, inverted trees, with the root at the top, used to present taxonomical knowledge, and organisational or evolutionary charts. The horizontal trees, on the other hand, are used to show flow charts, and mind and linguistic maps, while multidirectional and rectangular trees show computer algorithms.
🌳 As The Book of Circles by Manuel Lima, this gorgeously-illustrated book shows much what is already there, but, unfortunately, also provides few insights as to what it all actually means or how one tree symbol may be related to another.
A walk through the use of tree diagrams and related techniques as memory aids and data visualizations, from illuminated manuscripts to modern technology. Gorgeous illustrations.
Sometimes interesting, sometimes dull. It gets pretty repetitive at times, what with all the Christ trees and software map trees. Definitely more of a rifle-through book than a cover-to-cover read.
Livro excelente para profissionais e entusiastas da infografia que procurem inspiração e formas diferentes de representar estruturas hierárquicas. Manuel Lima mostra diversos gráficos para a mais variedade panóplia de aplicações.
Perchè ogni qualvolta ci troviamo ad osservare degli alberi antichi siamo presi come da un timore primordiale? Date uno sguardo a questi alberi, ingranditeli sul vostro pc e poi fatemi sapere la sensazione di timore, meraviglia, smarrimento che ne ricavate guardandoli. Meglio ancora, se questa sensazione la vivete dal vivo, come sicuramente ognuno di noi ha potuto provare di persona, quando ci troviamo in montagna, davanti ad una quercia o ad un ulivo.
La verità è che noi uomini siamo legati agli alberi come in un abbraccio elementare, sia da un punto di vista simbolico che biologico. Noi dipendiamo da essi, a cominciare dall'aria che respiriamo, fino alle tante metafore che nel corso dei millenni essi hanno fatto nascere nella mente degli uomini.
Gli alberi modellano la nostra storia, la nostra mitologia, fino a farne una chiave di comprensione della nostra stessa evoluzione. Scrittori, poeti e artisti, ma anche scienziati sono stati attratti dalla loro bellezza e dai loro misteri. Perfino alle "radici" della nostra lingua, di tutte le lingue, l'albero sembra essere il principio di tutto. Le radici di tutta la nostra conoscenza, intendo dire.
Perché di questo si tratta. Di conoscenza si occupa questo bellissimo libro che non ho acquistato in ebook, ma in versione cartacea. E' proprio in occasioni come queste che il libro tradizionale ha la meglio sul libro digitale. Lo devi avere tra le mani. Carta patinata, lucida, ancora profumata di stampa. Le grandi illustrazioni a colori, la rilegatura in tela. Devi possedere la fisicità dell'oggetto libro, proprio come gli alberi di cui stai leggendo. Perché sai benissimo che tra quel libro e gli alberi c'è un rapporto stretto, diretto, naturale.
L'autore di questo libro non è soltanto uno scrittore ma anche un artista, un disegnatore, un progettista, un creativo che ha avuto già modo di dimostrare la sua bravura nel concettualizzare gli alberi come strumento e occasioni di conoscenza. In un libro precedente ha saputo sintetizzare graficamente i processi visivi legati alla comunicazione.
Potete vedere alcune immagini a questo link. Con questo nuovo libro Manuel Lima esplora otto secoli di diagrammi ad alberi, dai manoscritti di Cartesio ai moderni alberi cognitivi digitali. Centinaia e centinaia di immagini offrono al lettore l'affascinante storia visiva di come la metafora degli alberi si sia evoluta in modo da dare un volto armonico al progresso della civiltà umana. Racchiusa in undici tipi di alberi l'autore riesce a sintetizzare tutta storia della conoscenza umana.
Alberi figurativi Alberi verticali Alberi orizzontali Alberi multidirezionali Alberi radiali Alberi iperbolici Mappe ad alberi rettangolare Mappe ad alberi voronoi Mappe ad alberi circolare Mappe a macchia solare Alberi a ghiaccioli
Ecco alcuni famosi esempi di alberi applicati alla conoscenza nel corso dei secoli:
"Distribuzione genealogica delle arti e delle scienze" di Chrétien Frederic Guillaume Roth dalla "Encyclopédie"(1780). L'albero riproduce la struttura genealogica della conoscenza seguendo le indicazioni di Francesco Bacone. La memoria e la storia a sinistra, la ragione è la filosofia al centro, l'immaginazione è la poesia a destra.
"L'albero delle virtù" di Lambert of Saint-Omer, (anno 1250). Illustrazione ad albero di palma disegnato da un prete di nome Lambert per una delle più antiche enciclopedie contenente disegni e manoscritti sistemati in maniera cronologica. L'albero di palma è l'albero sacro della Chiesa, ricco di associazioni simboliche e motivi cristiani.
Per secoli e secoli gli alberi hanno avuto un enorme significato nella nostra esistenza. Essi ci hanno dato riparo, protezione, cibo, ma anche medicine, energia, attrezzi, costruzione. È normale il fatto che gli uomini abbiano affidato agli alberi l'idea di nascita, crescita, sviluppo, decadenza e rinascita.
Tutte le culture hanno adottato simboli e riferimenti legati agli alberi di tipo esistenziale e religioso. Gli alberi sono stati anche venerati come delle divinità. La dendrolatria (adorazione degli alberi) è legata alla idea di fertilità, immortalità e rinascita.
Ricordiamo l'albero della vita che ha caratterizzato la recente Expo di Milano. Mitologia e folklore si mescolano, come anche religione e natura, attraendo l'attenzione di poeti, scienziati, artisti non solo per la loro bellezza ma anche per un sotteso senso e fascino del mistero sul quale si basa tutta la natura. La loro forza evocativa attrae in maniera così evidente da superare tutte le barriere razziali, ideologiche o religiose che gli hanno eretto nel corso della loro storia.
Sembra chiaro a questo punto quanta importanza abbiano avuto nel tempo e nello spazio i simboli legati alla realtà naturale degli alberi, non solo in termini religiosi ma anche sociali, umani e spirituali. La loro bellezza grezza e spontanea ha attirato l'attenzione di scienziati, filosofi e artisti per le loro intrinseche qualità evocative.
"L'Albero della vita" di Gustav Klimt (1901), è uno dei più famosi quadri ispirati da alberi, una congiunzione tra l’attesa e la riconciliazione. Spezza la freddezza della solitudine della prima donna con il calore dei due amanti. La differenza lampante tra il primo e il secondo pannello appare nella geometria delle vesti: la prima donna presenta motivi rigidi, triangolari, mentre le due figure sono contraddistinte dalla concentricità del cerchio.
Tra una marcata solitudine inquieta e un abbandono pervaso dall’estasi. Sui rami dell’albero alto vi è appollaiato un uccello nero che spicca quasi al centro dell’opera per la sua mancanza di colore. Questi altri non è che la figura della morte, la minaccia sempre presente che, seduta, attende.
Tra i molti artisti che hanno messo al centro della loro arte gli alberi va ricordato anche Leonardo da Vinci. Verso il 1515, poco prima della sua morte, in uno dei suoi numerosi disegni, elaborò una formula matematica per stabilire la relazione tra la grandezza del tronco di un albero e quella dei suoi rami. Egli affermò che man mano che i rami crescono, la loro grandezza equivale a quella del tronco dell'albero. Un modo, secondo questa tesi, con il quale gli alberi si difendono dalla forza dei venti. Moderni studi hanno smentito questa tesi che riguarda soltanto alcuni alberi. Resta, comunque, certa la loro resistenza al vento.
La primitiva relazione simbolica con l'albero spiega perchè lo schema a rami ha costituito non solo un importante motivo iconografico ma anche significativa metafora per i sistemi della conoscenza e della classificazione. In tutta la storia umana la struttura ad albero è stata utilizzata per affermare le varie facce della vita: parentela, origini, consanguineità, sviluppo, origini, crescita, e tante altre innumerevoli facce. Tutte virtù, sistemi di leggi scientifiche, morali, religiose, culturali, modelli programmatici utili ed indispensabili per esprimere concretamente la materializzazione e la molteplicità di una originaria unità dei destini umani.
Anche nel Giardino Segreto dell'Anima, nel villaggio di Campinola, uno dei tredici villaggi che formano il Comune di Tramonti, nella Valle che costituisce il polmone della Costa di Amalfi, la prossima estate festeggeremo intorno al suo albero della vita, perduto e poi ritrovato, un denso programma di eventi a partire dal mese di marzo. Il suo instancabile ed impagabile Patron Antonio De Marco lo sta approntando unitamente alla sua gentile consorte Enza Telese e al loro figlio Giancarlo. https://goo.gl/S0W5d4
When I first saw this book I was blown away. Of course, I had seen information presented in trees before and had even developed some small family trees..and used decision trees for some purposes but I had never seen a book devoted just to visualising information via tree patterns. I guess, in the final analysis I was a bit disappointed in the book. Basically it is a historical overview of the use of tree type diagrams ...or branching diagrams. They have been used in theology, in family trees and in trees of laws and evolutionary trees. More modern presentations include the use of circular trees and logarithmic trees. And probably, one of the more useful variations is the rectangular "tree" where information is packed into a rectangular shape and the size of the rectangles is really proportional to a percentage of the whole. The use of this format has become quite common with trade figures such as imports and exports by commodity, by country, by value etc. Generally, the approach is to let the pictures speak for themselves ...with a few very old trees (as old as the author could find examples) ranging through to quite modern examples. I guess, I was a little disappointed that there was little or no guidance on using such trees in the presentation of data. No summary of the pros and cons of each or recommendations on using modern programs with the various trends layouts. So in this sense the book was a bit of a let-down. It promised more than it delivered. The illustrations are great and some of the newer tree forms such as Voronio Treemaps were both fascinating and attractive....and probably useful. I give it three stars.
An excellent historical description of how trees are used to demonstrate data and knowledge. More of a coffee table book with outstanding photos. I learned about ars memorativa ("art of memory"), a way to memorize large amounts of information by visualizing rooms, with each room containing a separate memory. Also, enjoyed learning about the Digital Ecosphere (p.74) and Veroni treemaps, which look a lot like histology slides.
What is missing? Practical ways to incorporate the data visualization methods. I would have appreciated links and apps (free or not) that permit readers to incorporate the methods into their own work. A major oversight.
My unexpected yin-yang take home: we try to depict biology (or human-developed knowledge) using numbers. However, our best data visualization often ends up looking like biology.
Might make a nice gift for scientists, designers, or communications experts.
This book is strange. The introduction is the first "half" of the book and is all the text in the book. The second "half" is all graphics and titles.
The introduction tells the history of graphic representations of facts, with some illustrations. It is a great introduction except that it isn't an introduction. It's the whole story.
Then come the graphics. Take out your magnifying glass! The graphics are excellent showing the development of trees over the course of history. However, the author goes beyond trees and on to other graphic representations that give the same information as trees, but aren't trees, but the author calls them "trees" and then "treemaps". Look that one up in your thesaurus!
I really enjoyed this book (which is about data visualization using tree diagrams, not trees themselves), but I much preferred the first half, which shares more interesting historical examples of the tree being used in visualizing data. The last 3 or 4 sections, which for the most part only show post-digital tree diagrams, could have been clumped together, as segmenting out each type of diagram led to too much repetition with too little payoff. That being said, it's worth the trip to the library if the topic interests you.
My favorite part was the symbolism and history of tree imagery through various cultures/times. It is weird to think about organization and data visuals through the metaphor of a tree, and admittedly something I admittedly had not thought about before. The more computer generated/data organization parts lost me as a lay person a bit, but the idea of branches and roots was interesting to me.
I scanned bits of the book, and not enough to warrant a deep comment. That said, the book is beautiful with copious colored graphics. Trees of knowledge are sophisticated and diverse like trees in a forest. I'm surprised to learn there are many types of trees. It has an index that is huge and probably a complete text for study of knowledge and thought.
Visually commanding and very informative text that amounts to a history of attempts to organize knowledge in a hierarchical fashion. One of a trilogy of such books from the same author. A must-have for information specialists, librarians, and tree lovers.
Not exactly what I was expecting, but still an interesting look at different ways of organizing items in a "tree" like manner. Lots of vocabulary words I was unfamiliar with different types of diagrams.
You'll definitely want a magnifying glass while reading. A nice mix of gorgeous old tree maps and minimal computer generated style maps. Can't say I read every single word but I got a good overview.
Read a hardcover which was somewhat challenging as the print was often too small and details quickly lost, even on large pages. This would be perfect in a digital and hi def format. Hours of enjoyment.
TODO full review: +++ An ultimate guide on tree-like information visualization. Includes (1) an excellent history and state-of-the-art survey of techniques for the visualization of information in a tree-like form, and (2) many of the important software packages and scientific software that can create such forms. + Types of tree-like graphs, one per chapter: (1) figurative trees, with visualizations trying to match as closely as possible the metaphor of a tree (roots, trunk, branches, leaves, etc.), (2)/(3) vertical/horizontal trees (why two categories?!), (4) multidirectional trees, (5)/(6) (opposite to type (4),) radial/hyperbolic trees, (7)/(8)/(9) space-filling trees, rectangular-space treemaps, any-space Voronoi treemaps, and circular treemaps, respectively, (10) Sunbursts, and (11) Icicle trees. +++ Excellent coverage of historical figures involved in the development of the earliest form of each graph. For example, I loved to see how the rectangular treemap of Ben Schneiderman was credited, but also it was clear that his ideas were preceded by similar concepts in much earlier graphs (in this book, the author acknowledges the contribution of William Channing Woolbridge, whose chart compares the area of continents and countries; Edward R. Tufte credits Charles Louis de Fourcroy for his Tableau Poléometrique, drawn in 1782). ++ Good coverage of the historical, recent, and present-day projects, including: Karl Kempf's The Computer Tree, CNN's Ecosphere Project, Chris Harrison's Web Trigrams, Andreas Lundqvist and Danjan Rodic's Debian Family Tree (expanded to include all Linuxes), Stefanie Posavec's Writing Without Words, Oli Larouelle's Invisible Commitments (on Processing), Yifan Hu's AT&T Labs Tree of Life, Jeffrey Heer et al.'s Flare Package Tree, Moritz Stefaner's MACE Taxonomy, Hartmut Bohnacker et al.'s Generative Design, Werner Randelshofer's Treeviz, +++ Excellent coverage of present-day and academic software to produce the state-of-the-art graphs, including: Jarke van Wijk's team's software to produce 3d-like "Botanical Visualizations of Huge Hierarchies", SequoiaView; Alexandru Telea's Code View; Jean-Daniel Fekete's InfoVis toolkit; Richard Wettel and Michele Lanza's CodeCity; etc. I even used or re-implemented some of these. - A notable exception: flame graphs, created by engineer Brendan Gregg for visualizing the dynamics of software.