What do you think?
Rate this book


296 pages, Hardcover
First published February 1, 1993
Founder and CEO of Financial Shenanigans Detection Group, LLC.
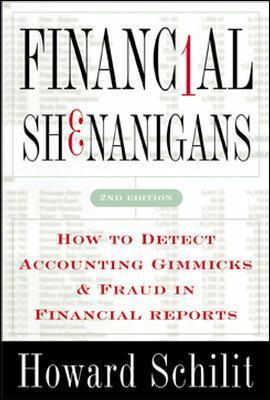
Dr. Howard M Schilit is an international leader in forensic accounting and corporate governance and author of Financial Shenanigans: How to Detect Accounting Gimmicks & Fraud in Financial Reports (McGraw-Hill) 3rd Edition, May 2010. He has been a leading spokesman before Congress, the SEC, and media outlets about causes and early warning signs of accounting tricks in public filings.
Follow me: http://twitter.com/HowardSchilit"
Over the period 1993–1995, WMI spent billions acquiring 444 companies. With these acquisitions came the inevitable one-time charges. The special charges became so common that during the seven-year period 1991–1997, WMI took write-offs in six of the seven years, totaling $3.4 billion. In 1997 alone, the special charges amounted to $1.6 billion. Since investors typically ignore special charges in evaluating profitability, WMI appeared to be in tip-top shape.
In vertical analysis for a given year, all balance sheet items are expressed as a percentage of total assets and all income statement items as a percentage of net sales. This technique enables analysts to quickly spot structural changes in the balance sheet or income statement over a period of time. For example, if inventory represented 20 percent of total assets in Year 1 and jumped to 28 percent in Year 2, an analyst could quickly spot that change using vertical analysis. Generally, the percentages remain fairly stable over time.
Horizontal analysis develops trends in balance sheet or income statement percentages over time. A particular year is designated the base year and percentage changes in subsequent years are computed. Generally, the percentage change in sales would also be reflected in the percentage change in expense accounts and in working capital accounts on the balance sheet.